记录一下用过的一些Matlab画图技巧📈
持续补充中
基础知识
折线图
箱线图
箱线图x轴标签方向1
boxplot(X, 'Labels', {'40 R-L', '40 L-R', '50 R-L', '50 L-R', '60 R-L', '60 L-R'}, 'LabelOrientation', 'inline');
修改属性
坐标轴相关
获取坐标轴对象
1 | % 可以直接用gca命令来获取 |
关于坐标轴对象属性的文档在这里👇:
https://www.mathworks.com/help/matlab/ref/matlab.graphics.axis.axes-properties.html
设置显示网格(可以只显示单一轴的网格)
1 | % 只显示x轴网格 |
设置是否显示坐标轴刻度
1 | % 隐藏坐标轴刻度 |
图例相关
获取图例对象
1 | leg = legend(...) |
图例对象的相关属性文档:
https://www.mathworks.com/help/matlab/ref/matlab.graphics.illustration.legend-properties.html
设置图例方向
1 | % 可以选择横向或竖向 |
设置多列显示
1 | % 可以通过调节列的数量来做到多列显示 |
设置每一个图例的大小
1 | leg.ItemTokenSize = [216,40]; |
美化小技巧
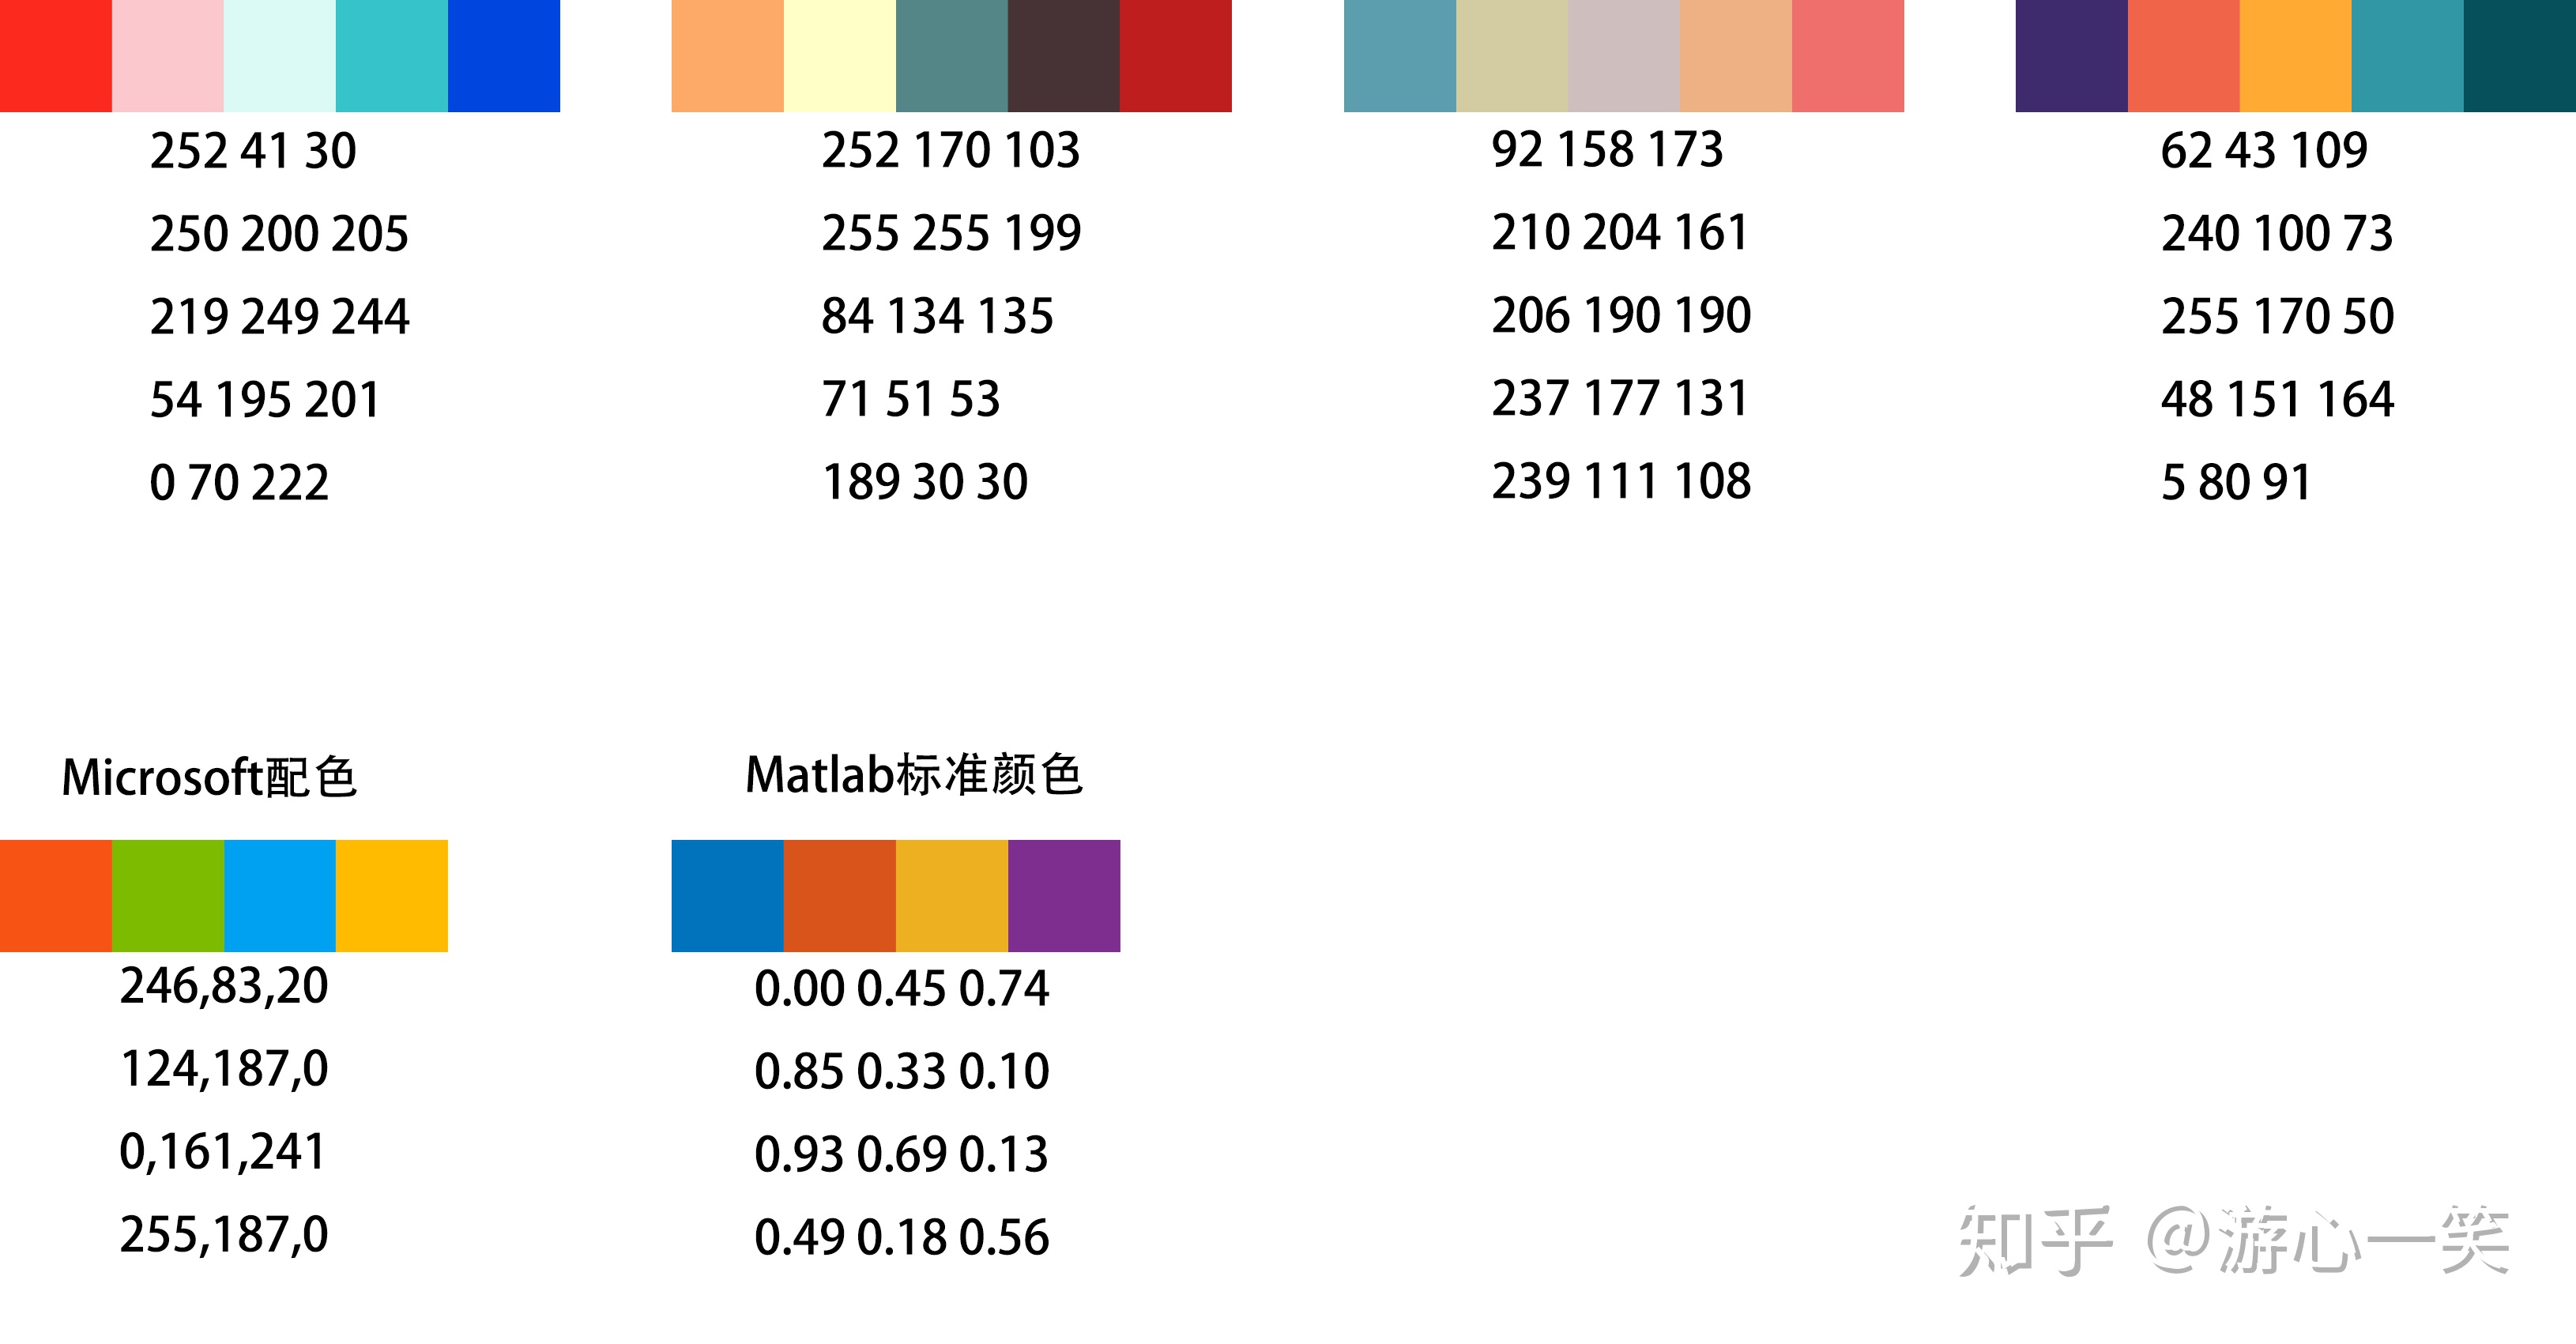
颜色搭配
这里推荐知乎博主的搭配:

以及日本传统色这个网站,可以找到很多不错的颜色:
https://nipponcolors.com/
画图速查表
非常有用的画图速查表:https://github.com/Pjer-zhang/matlabPlotCheatsheet

参考资料
一些小技巧和基础知识:
https://zhuanlan.zhihu.com/p/82421043
figure对象的相关知识:
https://zhuanlan.zhihu.com/p/47487701
画图颜色搭配:
https://zhuanlan.zhihu.com/p/58810578
画图速查表:
https://github.com/Pjer-zhang/matlabPlotCheatsheet
https://zhuanlan.zhihu.com/p/112229373
图坐标轴相关属性:
https://www.mathworks.com/help/matlab/ref/matlab.graphics.axis.axes-properties.html
图例相关属性:
https://www.mathworks.com/help/matlab/ref/matlab.graphics.illustration.legend-properties.html